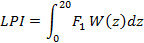
Surface manifestation of liquefactionIshihara (1985) published a paper containing observations on the protective effect that an upper layer of non-liquefied material had against the manifestation of liquefaction at the ground surface. The paper contained graphs that plotted thickness of the upper non-liquefied layer (H1) and the thickness of underlying liquefied material (H2). The maximum acceleration is 400 to 500 gal in Ishihara's graph. The term "surface manifestation" is utilized to describe liquefaction-induced surface damage. A quantitative method using an index called the liquefaction potential index (LPI) was developed and presented by Iwasaki (1978, 1982). The LPI is defined as:
where W(z) = 10 – 0.5z, F1 = 1 - FS for FS < 1.0, F1 = 0 for FS > 1.0 and z is the depth below the ground surface in meters. The LPI presents the risk of liquefaction damage as a single value with the following indicators of liquefaction-induced damage:
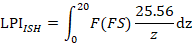
* Proposed by Dr. Fred Yi from “5 < LPI ≤ 15, Liquefaction risk is high”. The original liquefaction potential index (LPI) was improved by Maurer et al (2015) by assessing liquefaction hazard utilizing the Ishihara (1985) boundary curves for liquefaction surface effects. The new index is named Ishihara-inspired index, LPIISH.
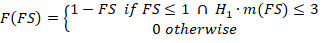
where
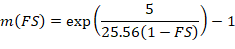
and
The LPI range and damage is modified as below:
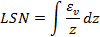
The most recent development for quantitative descriptions of liquefaction-induced surface damage, called "liquefaction vulnerability", was made by Tonlin & Taylor (2013) after the Christchurch earthquakes occurred between 2010 and 2011 and was based on field observations and analyses of approximately 7,500 CPT investigations. A new index, the liquefaction severity number (LSN), was proposed and defined as:
where εv is the calculated volumetric densification strain in the subject layer from Zhang et al. (2002) and z is the depth to the layer of interest in meters below the ground surface. The typical behaviors of sites with a given LSN are summarized in following table.
Both LPIISH and LSN indices and damages will be shown on the liquefaction output. References:1.Ishihara, K. (1985). Stability of Natural Deposits During Earthquakes Proceedings of the 11th International Conference on Soil Mechanics and Foundation Engineering, San Francisco, 1:321-376. 2.Iwasaki, T., Arakawa, T. and Tokida, K. (1982). Simplified Procedures for Assessing Soil Liquefaction During Earthquakes Proc. Conference on Soil Dynamics and Earthquake Engineering. Southampton, 925-939. 3.Iwasaki, T., Tatsuoka, F., Tokida, K.-i., and Yasuda, S., (1978). A practical method for assessing soil liquefaction potential based on case studies at various sites in Japan, in Proceedings, 2nd International Conference on Microzonation, San Francisco, pp. 885–896. 4.Maurer, B. W., Green, R. A., and Taylor, O.S., 2015, Moving towards an improved index for assessing liquefaction hazard: Lessons from historical data, Soils and Foundations 2015; 55(4): 778-787, The Japanese Geotechnical Society 5.Tonkin & Taylor Ltd, 2013, Liquefaction vulnerability study, Report prepared for Earthquake Commission, New Zealand |
||||||||||||||||||||||||||||||||||||||||||||