Compression Results:
Compression results can be plotted in 3 dimensional view and 2 dimensional view.
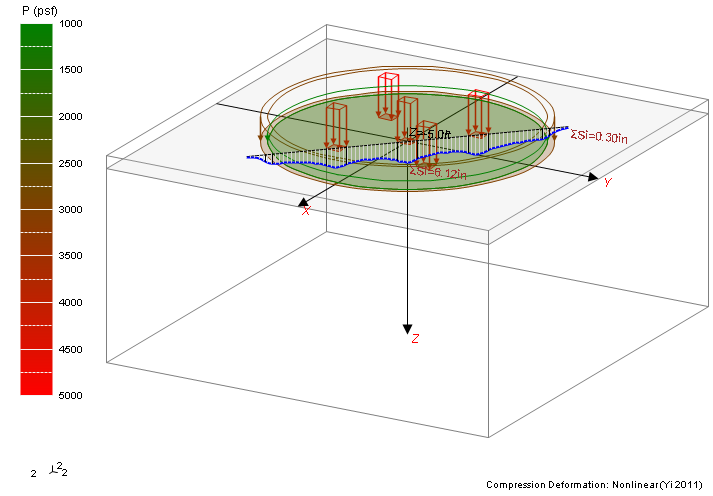
Options for 3D Compression output:
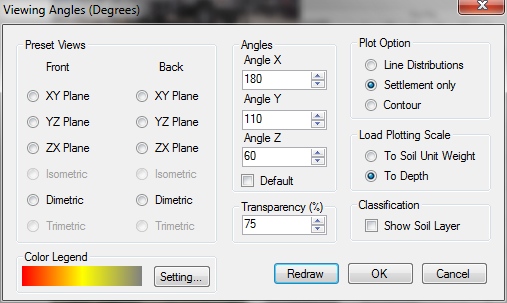
 Preset Views: select from 12 preset view
Angles: select rotational angle for X, Y, and Z axises. Default values are shown.
Transparency: select value for transparency
Plot Option:
Line distributions: plot deformations along vertical calculated lines. This option is better for fewer
calculated points
Settlement only: plot surface settlement along calculated line
Contour: plot contours in XY plane (under development)
Load Plotting Scale:
To Soil Unit Weight: scale the maximum load based on soil unit weight
To Depth: scale the maximum load to be 10% of the maximum depth
Classification: show soil layer based on soil classification
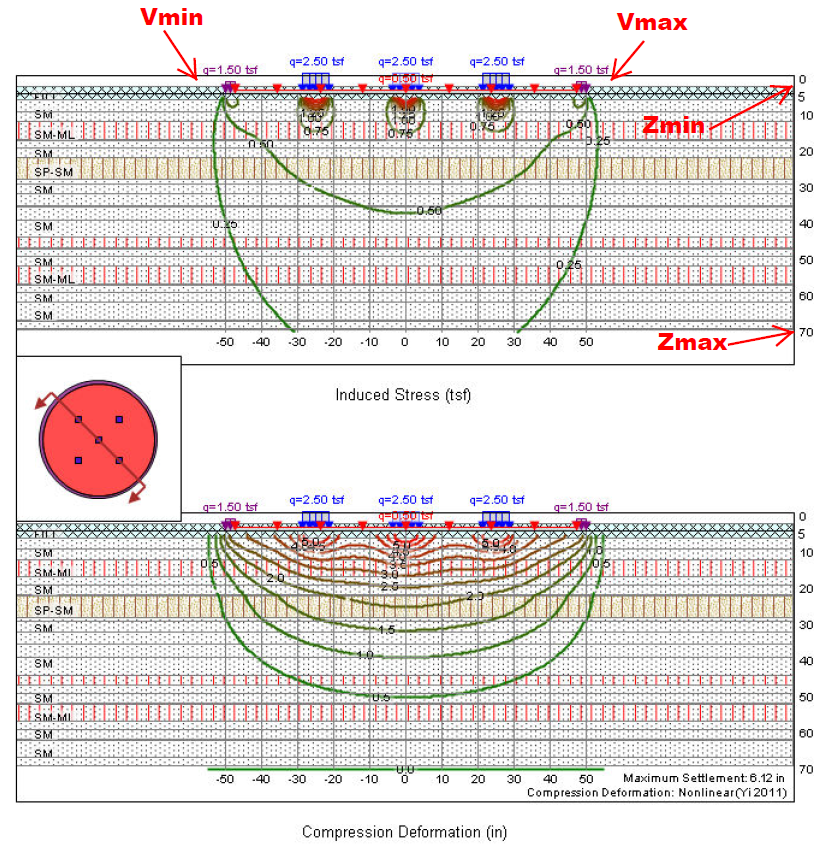
Options for 2D Contours of Induced Stresses and Compression Deformation:
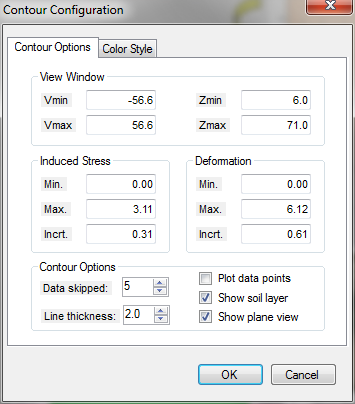
Contour Options page:
View Window: (see image above)
Vmin: left side coordinate
Vmax: right side coordinate
Zmin: minimum depth
Zmax: maximum depth
Induced Stress:
Min: minimum value of stress contour
Max: maximum value of stress contour
Incrt.: stress contour increment
Deformation:
Min: minimum value of deformation contour
Max: maximum value of deformation contour
Incrt.: deformation contour increment
Contour Options:
Data skipped: stress and deformation are calculated approximately every 0.5 ft (15 cm) in vertical direction. You can skip some vertical points in plot. The default value is 2.
Line thickness: change line thickness. The default value is 2 pixels.
Plot data points: show data points on your plot
Show soil layer: if checked, show USCS soil layers. Otherwise, plot 2D color contour
Show plane view: show plane view of footings
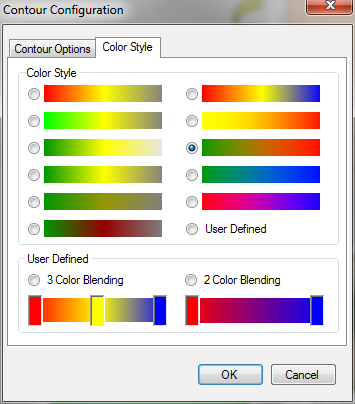
Color Style page:
Select color legend for 2D color contour.
|