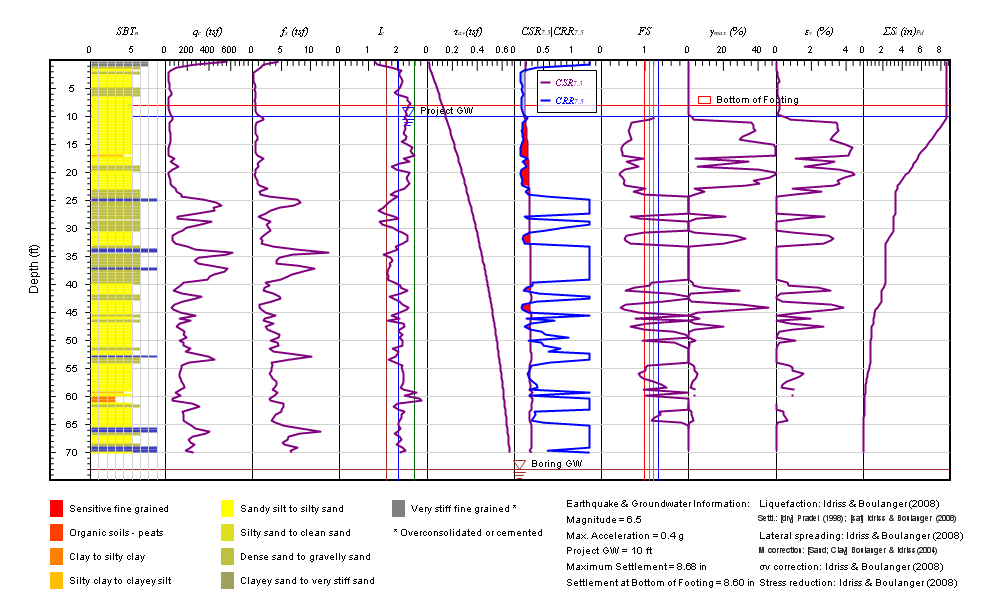
Liquefaction Results:
Liquefaction results are tiled horizontally as shown below. You can select various parameters for output.
Common options:
 Title: you can select plotting title from Liquefaction, Seismic Settlement and Lateral Spreading
Depth scale: Plotting maximum depth is automatically scaled to the whole number to 5 feet for English unit system or 2 meters for Metric unit system. You can also input your own number
Max. No. of Graphs in 1 Plot: Output results are tiled horizontally as shown above. You can change the maximum number of graphs plotted on a single page
Site Class: You can choose to show Site Class on soil profile. Site Class definitions are in accordance with 2010 California Building Code.
SPT Results:
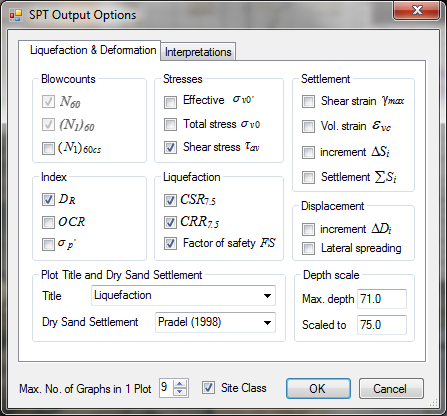
parameters in SPT results are grouped in six groups:
Blowcounts: corrected blowcounts, N60, (N1)60, and (N1)60cs
Index: relative density (DR), overconsolidation ratio (OCR) and preconsolidation stress (σp')
Stresses: effective and total stresses and shear stress (σv0', σv0 and τav)
Liquefaction: cyclic stress ratio (CSR7.5), cyclic resistance ratio (CRR7.5) and factor of safety of liquefaction (FS)
Settlement: maximum shear strain (γmax), volumetric strain (εvc), settlement increment (ΔSi), accumulated settlement (ΣSi)
Displacement: lateral displacement increment (ΔDi) and accumulated lateral spreading displacement (ΣDi)
You can select output parameters from each group.
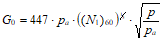
In addition, you can select dry sand settlement from Pradel (1998) method or modified Pradel method. The main difference between Pradel (1998) method and modified Pradel method is the calculation of initial shear modulus, G0:
In Pradel method,
 (Seed & Idriss, 1970) (Seed & Idriss, 1970)
In modified method,
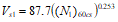 (Andrus et al., 2004) (Andrus et al., 2004)
 (Andrus, 2000) (Andrus, 2000)

CPT Results:
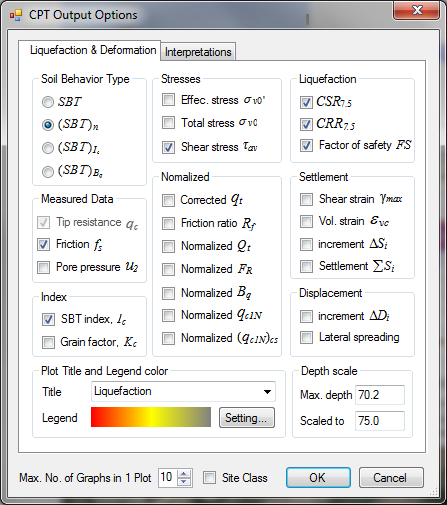
You can select CPT interpreted parameters from 8 groups:
Soil Behavior Type: including non-normalized soil behavior type (SBT), and normalized soil behavior types [(SBT)n, (SBT)Ic, (SBT)Bc]
Measured Data: tip resistance (qc), friction (fs), and pore pressure (u2)
Index: soil behavior type (SBT) index (Ic), grain factor (Kc)
Stresses: effective and total stresses and shear stress (σv0', σv0 and τav)
Normalized: normalized parameters [qt, Rf, Qt, FR, Bq, qc1N, (qc1N)cs]
Liquefaction: cyclic stress ratio (CSR7.5), cyclic resistance ratio (CRR7.5) and factor of safety of liquefaction (FS)
Settlement: maximum shear strain (γmax), volumetric strain (εvc), settlement increment (ΔSi), cumulated settlement (ΣSi)
Displacement: lateral displacement increment (ΔDi) and cumulated lateral spreading displacement (ΣDi)
In addition, you can select color legend for SBT.
Vs Results:
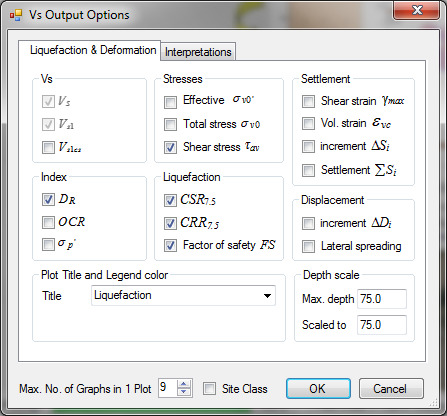
parameters in SPT results are grouped in six groups:
Vs: raw and corrected shear wave velocity, Vs, Vs1, Vs1cs
Index: relative density (DR), overconsolidation ratio (OCR) and preconsolidation stress (σp')
Stresses: effective and total stresses and shear stress (σv0', σv0 and τav)
Liquefaction: cyclic stress ratio (CSR7.5), cyclic resistance ratio (CRR7.5) and factor of safety of liquefaction (FS)
Settlement: maximum shear strain (γmax), volumetric strain (εvc), settlement increment (ΔSi), cumulated settlement (ΣSi)
Displacement: lateral displacement increment (ΔDi) and cumulated lateral spreading displacement (ΣDi)
You can select output parameters from each group.
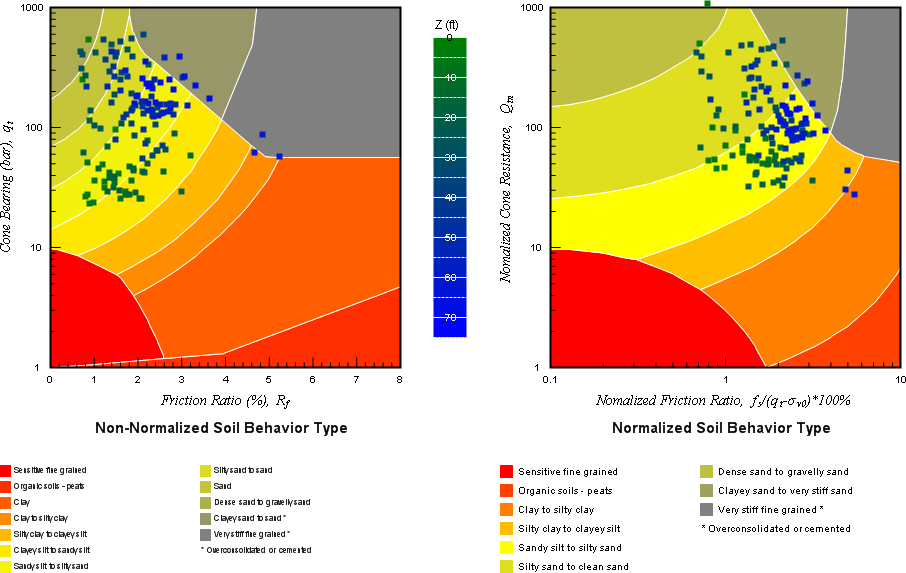
SBT Charts:
Plot Soil Behavior Charts with or without data on them for CPT results.
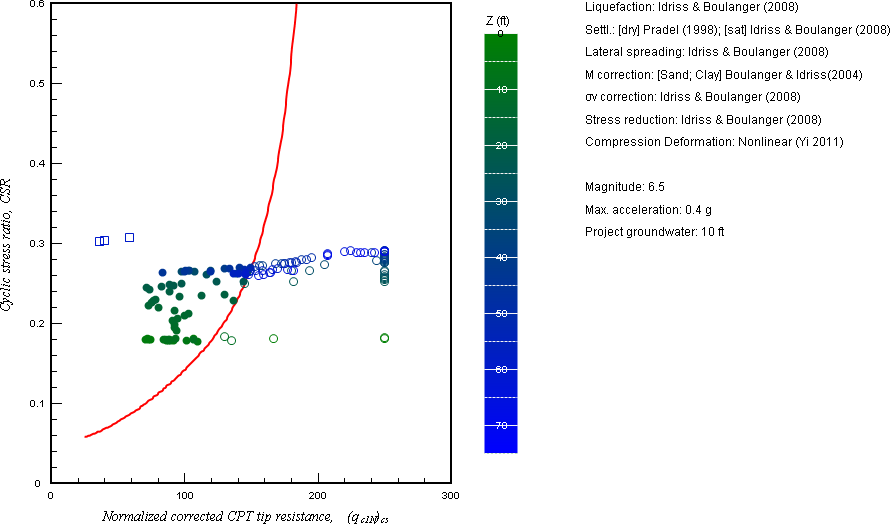
CSR Charts:
Plot Cyclic Stress Ration vs. Resistance chart with data on it for SPT, CPT and Vs data
|